K-Means Clustering on Customer Data With Python
One of the more useful things we can do with our customer data is to apply a clustering algorithm on it.
Furthermore, in this guide, we’re going to apply K-Means clustering algorithm on a shop customer dataset. But for that we’ll need customer data in the first place.
Therefore, we’re going to download the dataset we need from Kaggle by using their API.
But first of all, clustering is a type of unsupervised learning, where an algorithm groups similar data points together. Additionally, it does so by looking at their characteristics.
But it’s not all about finding the similarities, it also separates these groups or clusters apart.
About the dataset
The customer dataset we’re going to use for this guide provides us with a detailed analysis of hypothetical shop’s customers.
Furthermore, it includes 2000 records, each having 8 customer characteristics.
These characteristics are:
- Customer ID
- Gender
- Age
- Annual Income
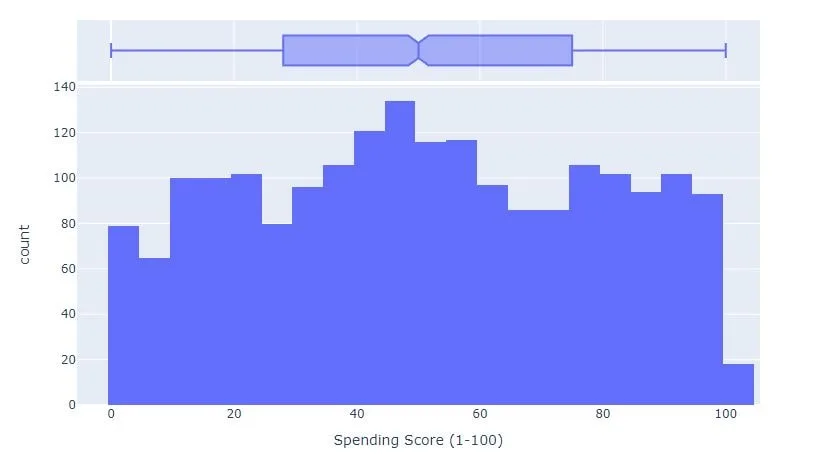
- Spending Score
- Profession
- Work Experience
- Family Size
By analyzing this kind of data, businesses can gain valuable insight into their customers’ preferences, behaviours, and purchasing habits.
For example, if we group together customers by taking into account available characteristics, we can better understand how each factor impacts their purchasing decisions.
Coding clustering for customer segmentation
We’re going to begin by importing the necessary libraries, that we’ll need. Thus we’ll import Kaggle in order to download the dataset, pandas, numpy, and sklearn to preprocess it and apply k-means clustering.
For this example, we’ll use silhouette score in order to evaluate our clustering algorithm’s performance of the customer data.
import pandas as pd
import numpy as np

from kaggle.api.kaggle_api_extended import KaggleApi

from sklearn.preprocessing import LabelEncoder
from sklearn.preprocessing import StandardScaler

from sklearn.cluster import KMeans
from sklearn.metrics import silhouette_score
Now, we have everything that we need, so next step is to download the dataset. In case you don’t have Kaggle API set up yet, I suggest you follow the guidelines from Kaggle API dataset download post.
# connect with the Kaggle API
api = KaggleApi()
api.authenticate()

# download customers dataset from https://www.kaggle.com/datasets/datascientistanna/customers-dataset
api.dataset_download_file(
    'datascientistanna/customers-dataset',
    file_name='Customers.csv',
    path='datasets'
)
Great, now thing we need to do is preprocess the data in order for our clustering algorithm to accept it. Moreover, this includes transforming categorical data, such as gender and profession, from strings into numbers.
And also excluding data that is not relevant for the purpose of this example use and could possibly hinder the customer clustering algorithm’s performance.
# import and preprocess dataset for clustering
df = pd.read_csv('datasets/Customers.csv')
df.drop(columns=['CustomerID'], inplace=True)
df.dropna()

categorical_columns = ['Gender', 'Profession']
numerical_columns = [col for col in df.columns if col not in categorical_columns]

for cat_col in categorical_columns:
    encoder = LabelEncoder()
    df[cat_col] = encoder.fit_transform(df[cat_col])

scaler = StandardScaler()
data = scaler.fit_transform(df)
We also normalized our data, in order to bring each characteristic value to an appropriate range.
Next, we’re going to apply k-means clustering for different number of clusters and find the optimal number using silhouette score.
# fit k-means clustering algorithm on different number of clusters ans store results
scores = []
labels = []

for k in range(2, 11):
    kmeans = KMeans(n_clusters=k, random_state=42)
    kmeans.fit(data)

    silhouette_avg = silhouette_score(data, kmeans.labels_)
    scores.append(silhouette_avg)

    labels.append(kmeans.labels_)
Now all that remains is for us to print out the best performing algorithm’s results, which includes optimal number of clusters and how many customers are in each cluster.
# print out results
best_score = np.argmax(scores)
best_k = best_score + 2
print(f'Best score achieved for {best_k} clusters.\n')
df['Clusters'] = labels[best_score]
print('Cluster values:')
print(df['Clusters'].value_counts())
Conclusion
To summarize, we just wrote a python customer clustering algorithm using k-means clustering and silhouette score for evaluation.
I hope this article helped you gain a better understanding how clustering works and maybe even motivate you to learn even more.